<iframe src="https://www.googletagmanager.com/ns.html?id=GTM-W3R8R6G&gtm_auth=AU1ugrxhJK_EQcp9wg5qxA&gtm_preview=env-1&gtm_cookies_win=x" height="0" width="0" style="display:none;visibility:hidden"></iframe>

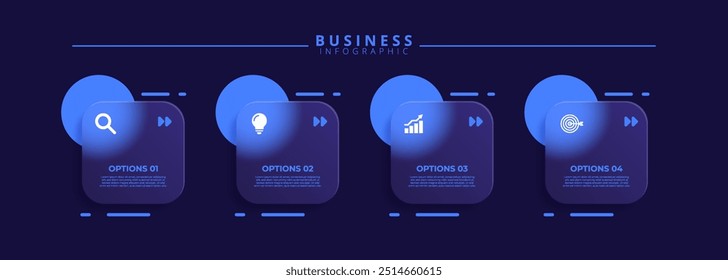
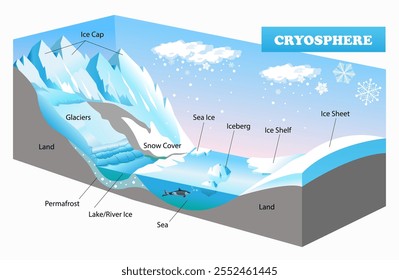
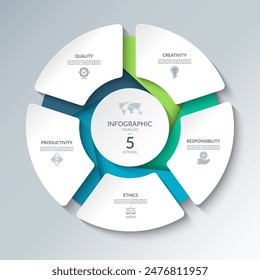
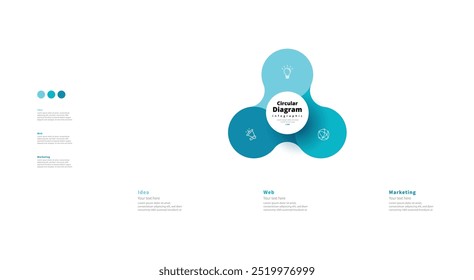
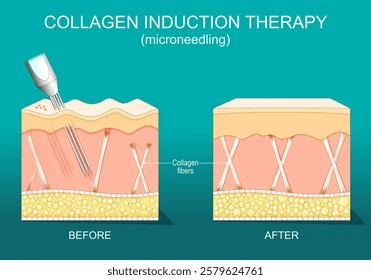
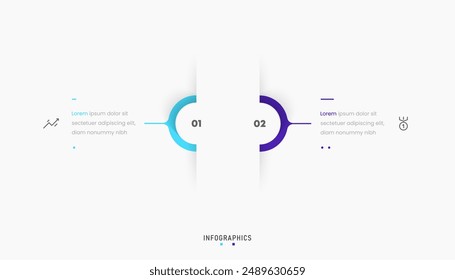
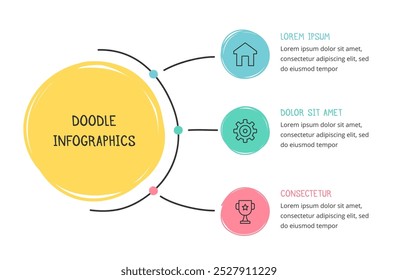
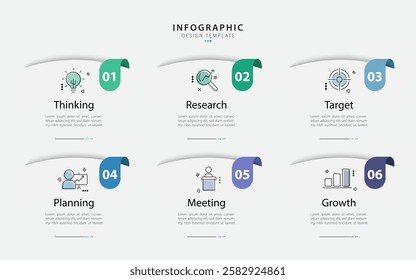
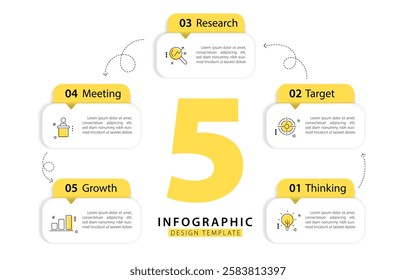
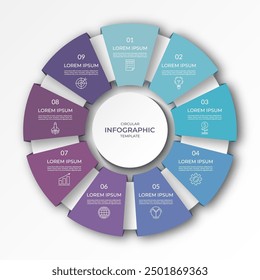
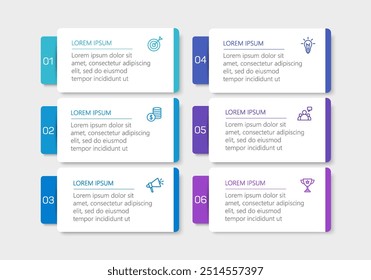
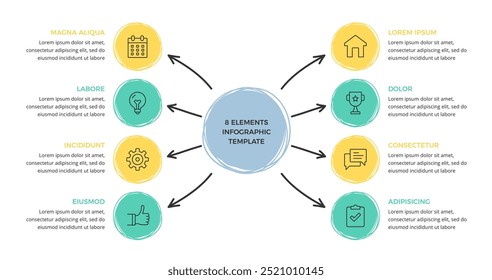
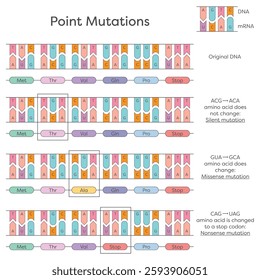
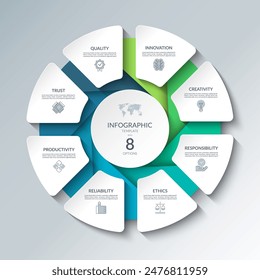
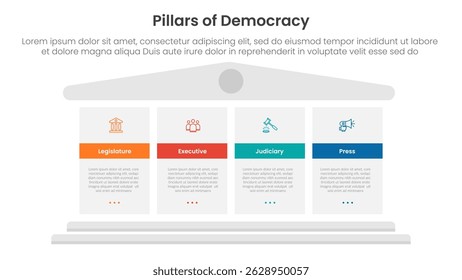
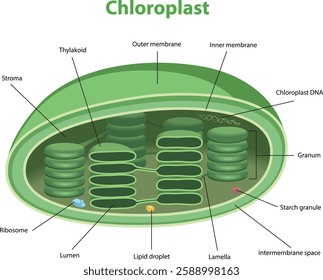
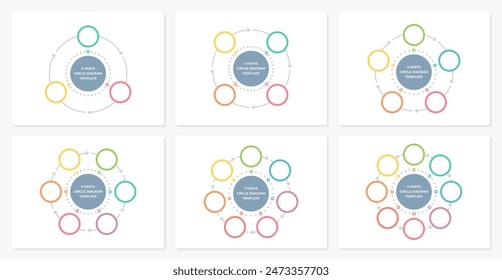
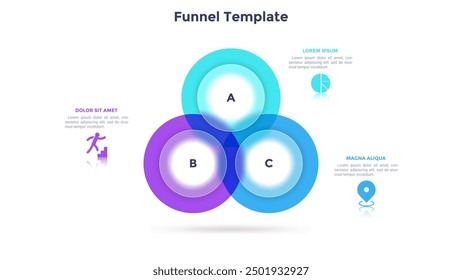
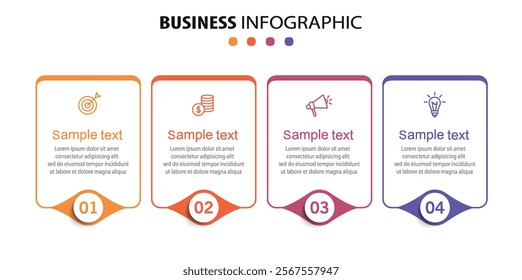
460 diagramm Vektor Designs für T-Shirts und Merch

Downloade & kaufe bearbeitbare diagramm AI Vektorgrafiken für T-Shirts, Telefonhüllen, Buchcovers und andere Artikel Merch

Sortieren nach

Am wichtigsten
Designvorlage für Infografiklabels mit Symbolen und vier verschiedenen Schritten. Ideal für Prozessdiagramme, Präsentationsfolien, Workflow-Schemata, Banner, Flussdiagramme und Datenvisualisierungen.
Kryosphäre. Eine der geographischen Schalen eines bestimmten Planeten. Eis- und Wasserdiagramm. Wissenschaftliche Bildung 3d Illustration
Infografik-Kreisdiagramm mit 5 Optionen. Runddiagramm, das für Business Analytics, Datenvisualisierung und Präsentation verwendet werden kann. Vektorillustration.
Infografik Hexagon geometrische Venn Diagramm Diagramm Diagramm Vorlage für Geschäftspräsentation mit venn Diagramm Elemente Vektorgrafik.
Moderne minimalistische elegante saubere kreisförmige 3 Schritte editierbare Diagramm Infografik Design Vorlage Vektor
Infografik-Vorlage mit Symbolen und 4 Optionen oder Schritten. Kann für Workflow-Layout, Diagramm, Banner, Webdesign verwendet werden. Vektorgrafik
illustration of photosynthesis diagram - vector
Collagen induction therapy. Skin and Collagen fibers before and after Microneedling procedure. Skin rejuvenation. Fibroblast activation. Vector poster. Isometric Flat illustration. Schematic diagram
Vektorgrafik Infografik Label Design Vorlage mit Symbolen und 2 Optionen oder Stufen. Kann für Prozessdiagramme, Präsentationen, Workflow-Layout, Banner, Flussdiagramme, Infografiken verwendet werden.
Doodle-Infografiken, handgezeichnetes Diagramm mit drei Elementen, Vektorgrafik eps10
Infographic template. 6 Step timeline journey, Flat simple infographics design template. presentation graph. Business concept with numbers 6 options or steps vector illustration.
Earth's Atmosphere Diagram with Layers and Space Elements
Timeline Creator infographic template. 5 Step timeline journey, calendar Flat simple infographics design template. presentation graph. Business concept with 5 options, gantt vector illustration.
Infografik-Kreisdiagramm mit 9 Optionen, Teile. Neunstufiges Prozessdiagramm mit bunten Segmenten, anwendbar für Datenvisualisierung, Präsentation, Business-Infografiken.
Infografische Vorlage mit Symbolen und 4 Optionen oder Schritten. Kann für Workflow-Layout, Diagramm, Banner, Webdesign verwendet werden. Vektorillustration
anatomical illustration showing the trigeminal nerve and its ophthalmic, maxillary, and mandibular branches across the human face diagram hand drawn vector illustration. Medical science educational
Satz von Kreisdiagrammen von 1 bis 100 Prozent auf weißem Hintergrund. Infografik-Diagramm zur prozentualen Verfolgung. Kreisdiagramm Prozentanteil Infografik Design. Prozentrad. Vektorgrafik.
Geschäftsvektor Infografik Design-Vorlage mit Symbolen und 6 Optionen oder Schritte. Kann für Prozessdiagramm, Präsentationen, Workflow-Layout, Banner, Flussdiagramm, Infografik verwendet werden
Infographic template with icons and 3 options or steps. Isometric cube. Can be used for workflow layout, diagram, banner, webdesign. Vector illustration
Handgezeichnetes Diagramm oder Mind Map Template mit acht Elementen, Doodle-Infografiken, Vektorgrafik eps10
Image of a three-dimensional cross-section of skin
Designvorlage für Infografiklabels mit Symbolen und vier verschiedenen Schritten. Ideal für Prozessdiagramme, Präsentationsfolien, Workflow-Schemata, Banner, Flussdiagramme und Datenvisualisierungen.
Runddiagramm mit 3 kreisförmigen Elementen um die Mitte. Konzept der drei Merkmale des zyklischen Geschäftsprozesses. Minimale infografische Design-Vorlage. Moderne flache Vektorillustration zur Präsentation
Colorful Fishbone Diagram Infographic with Icons and Five-Step Process Vector Illustration
Semi circle pie chart divided into 5 parts with editable icons. A template for a presentation or website. Colorful infographics for business, startup, report, presentation, slides
Infographic Venn diagram chart template for business 5 parts, options, presentation with venn diagram elements vector illustration.
Infografik Kreis mit 7 Optionen, Teile. 7-stufige Vektorvorlage für Business-Infografiken. Prozessdiagramm, Zyklusdiagramm für Geschäftspräsentation, Bericht, Broschüre, Web, Datenvisualisierung.
Infografisches Runddiagramm mit 6 Optionen. Runddiagramm, das für Business Analytics, Datenvisualisierung und Präsentation verwendet werden kann. Vektorillustration.
Infographic template with icons and 2 options or steps. Gear . Can be used for workflow layout, diagram, banner, webdesign. Vector illustration
infographic diagram explaining how a jet engine works with labeled stages of intake compression combustion and exhaust
Melanin in the human skin poster. Melanocytes produce skin light or dark pigmentation. Absorbing harmful UV rays, protecting cells in dermis and epidermis from sun damage flat vector illustration
Geschäftsinfographie. Konzept dünne Linie Infografik Vorlage mit 4 Schritten oder Optionen, Präsentation, Prozessdiagramm.
Chalk drawings of arrows and frames. Hand drawn charcoal symbols for hand drawn diagrams. Vector doodle marker drawing. Freehand different curved arrows, swirls, crosses, circles, ovals and scribble.
50 Prozent Tortendiagramm. Symbol isoliert. Vektorgradientenelement. Infografik-Zeichen. Illustration, Symbol für Unternehmen, Finanzen, Bericht, Webdesign, Download, Präsentation
Basic circle infographic template with 7 steps, process or options, process chart, Used for process diagram, presentations, workflow layout, flow chart, infograph. Vector eps10 illustration.
Internal organs in the child body poster. Anatomical diagram with lungs, liver, brain and stomach, intestines, heart around baby silhouette with all biological system medical flat vector illustration
DNA substitution, deletion, and insertion point mutations diagram
4 stage infographic diagram with vertical box container with circle on top with arrow line direction with 4 step for slide presentation vector
Workflow-Konzept für Infografik mit 2 Schritten, Optionen, Teilen oder Prozessen. Visualisierung von Geschäftsdaten.
Infografisches Runddiagramm mit 8 Optionen. Runddiagramm, das für Business Analytics, Datenvisualisierung und Präsentation verwendet werden kann. Vektorillustration.
4 Säulen Demokratie Infografik Vorlage Banner mit großen Block Säulen für Folie Präsentation Vektor
Vector design. Optical illusions, linear perspective, and vector field diagrams in cyan blue on dark background, creating depth and structured complexity. Science. Modern aesthetics, minimalist art.
Circular scheme with three round paper white elements. Concept of cyclic business process with 3 stages. Minimal infographic design template. Modern flat vector illustration for data visualization.
Vektorgrafik Infografik Label Design Vorlage mit Symbolen und 6 Optionen oder Stufen. Kann für Prozessdiagramme, Präsentationen, Workflow-Layout, Banner, Flussdiagramme, Infografiken verwendet werden.
WAN or wiled area network of computer networking. LAN or Local area network 3D diagram. Internet technology concept.
Infografik Kreisdiagramm mit 4 Optionen, Teile. Vierstufiges Prozessdiagramm mit bunten Segmenten, anwendbar für Datenvisualisierung, Präsentation, Business-Infografiken.
illustration of chloroplast structure diagram - vector
Sechs leere Kreisdiagramm Vorlagen Set - 3, 4, 5, 6, 7 und 8 Teile, Kreis Infografiken, Vektorgrafik eps10 Abbildung
Venn-Diagramm mit drei überlappenden transluzenten runden Elementen. Konzept von 3 Bereichen oder Bereichen der Unternehmensanalyse. Minimale Infografik-Entwurfsvorlage. Moderne flache Vektorgrafik für Banner.
Business infographic design template with 4 options, steps or processes. Can be used for workflow layout, diagram, annual report, web design
Gesponserte Ergebnisse von Shutterstock Logo
Erhalten Sie 15% Rabatt mit dem Code: VEXELS15

von 10